The Climate Clock: Counting down to 1.5℃
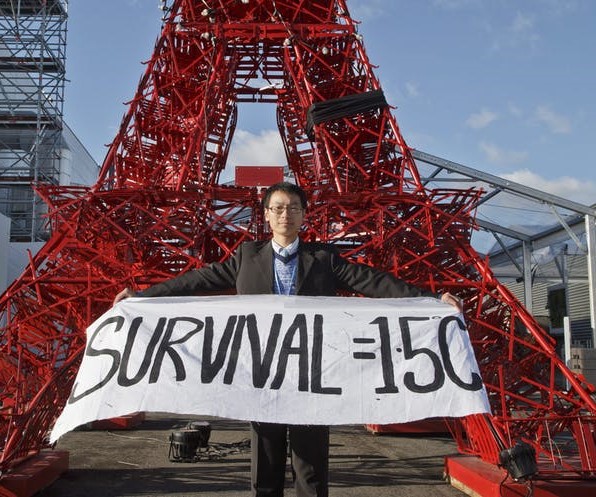
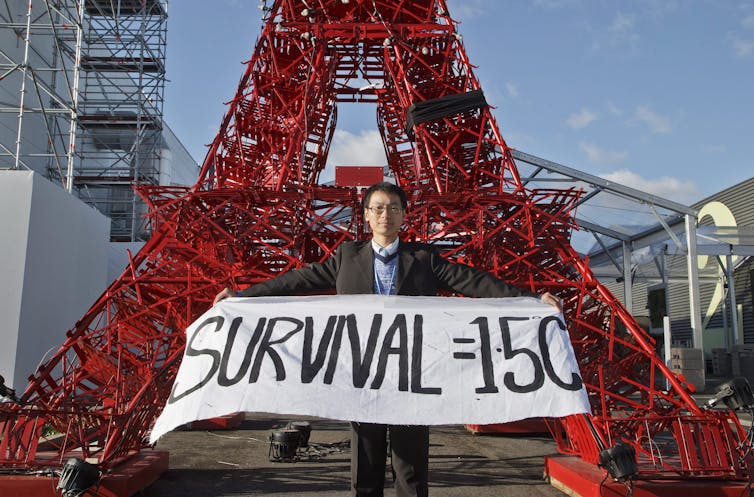 An NGO representative stands in front of a replica of the Eiffel Tower at the Paris climate change conference in December 2015. (Michel Euler/AP Photo) H. Damon Matthews, Concordia University; Glen Peters, Center for International Climate and Environment Research - Oslo; Myles Allen, University of Oxford, and Piers Forster, University of Leeds
The Intergovernmental Panel on Climate Change (IPCC) Special Report on Global Warming of 1.5℃ has opened a window to limit global warming to 1.5℃ above pre-industrial levels, but carbon dioxide emissions are projected to increase in 2018 for the second year in a row. If this trend continues, emissions will drive global temperatures to 1.5℃ in less than 16 years.
The Climate Clock we created shows how quickly we are approaching 1.5℃ of global warming, given current emissions trends. Here, we present our third annual update of the clock in light of the most recent scientific data, released on Dec. 5, 2018.
The IPCC special report showed that 1.5℃ is an important threshold for many climate impacts. Weather extremes such as heat waves and extreme precipitation events are expected to increase with every increment to global temperature. The risk of irreversible ice sheet loss and consequent sea level rise increases sharply between 1.5℃ and 2℃, and nearly all corals could be wiped out at 2℃ warming.
According to the latest data from both the IPCC special report and the Global Carbon Project, we are heading towards 1.5℃ in a little less than 16 years. The IPCC report itself gave a range of 12-35 years to 1.5℃, if warming continues at the current rate. Unlike the IPCC report, the Climate Clock accounts for the fact that emissions are still rising, which will cause warming to accelerate.
Tracking the progression of climate mitigation
The Climate Clock was launched in 2015 as a way to visualize the timeline over which global warming is occurring, and to provide a measuring stick against which we can track climate mitigation progress. If emissions keep rising, the date we reach 1.5℃ will move closer. If emissions start to decrease, the date for 1.5℃ will move further away.
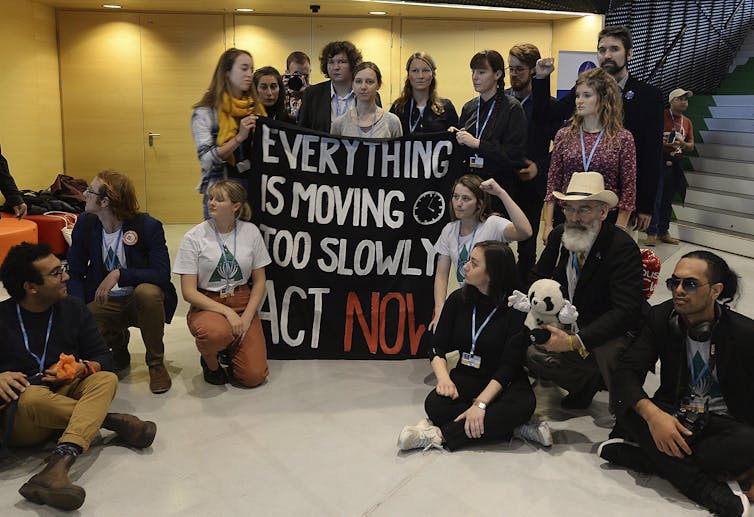 People protest at the COP24 climate summit in Katowice, Poland on Dec. 5, 2018. (AP Photo/Czarek Sokolowski)
Each year we have updated the clock to reflect the latest global CO2 emissions trend and rate of climate warming. In 2016, we saw the third year of stable CO2 emissions. This lack of increase in CO2 emissions extended the timeline to 1.5℃ by a year.
But in 2017, emissions increased, and the clock was set back by four months. Emissions for 2018 are now expected to increase again by 2.7 per cent. This is the largest increase in global emissions since 2011, and it moves 1.5℃ another eight months closer in time.
This year, our update of the climate clock also reflects a new estimate of the remaining carbon budget from the IPCC 1.5℃ report. This budget, which represents the total amount of allowable CO2 emissions between 2018 and the time we reach 1.5℃, has been revised upward to 770 billion tonnes of CO2. By itself, this increase in allowable emissions pushes the 1.5℃ date further away by more than two years.
The result of projected 2018 CO2 emissions and the revised carbon budget is that our estimate of the date of 1.5℃ now falls near the end of the year 2034.
A simple methodology
The Climate Clock answers the question: given the current rate of emissions and level of human-induced warming, and assuming the emissions trend over the past five years continues into the future, how long will it be before the remaining allowable emissions for 1.5℃ are used up?
To date, human activities have emitted close to 2,300 billion tonnes of CO2 since 1870 as a result of fossil fuel combustion and deforestation. These and other greenhouse gas emissions have caused global temperatures to increase by 1.06℃ relative to the 1850-1900 average. Over the past five years, annual CO2 emissions from fossil fuels have increased by an average of 0.4 billion tonnes each year, and in 2018, are expected to reach a record high of 37.1 billion tonnes.
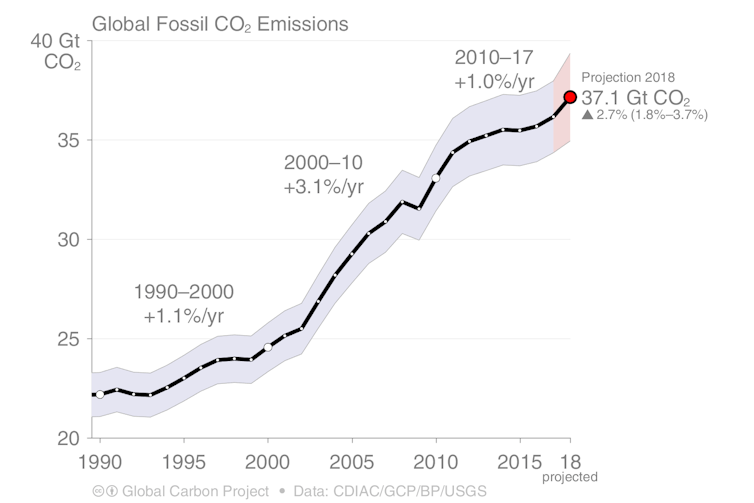 Global fossil fuel CO2 emissions, including projected 2018 emissions from the Global Carbon Project.
In creating the Climate Clock, we assume that this five-year fossil-fuel CO2 emissions trend will continue into the future, and that CO2 emissions from deforestation and land-use change remain constant at the most recent five-year average of 5.3 billion tonnes per year. By using the IPCC carbon budget estimate, we also assume that pollutants other than CO2, such as methane and nitrous oxide, will be responsible for approximately 25 per cent of the warming between now and 1.5℃.
How confident are we in our time estimate?
Our time estimate is sensitive to the uncertainties associated with the climate response to CO2 emissions. Here, we provide a best estimate, which means that there is a 50 per cent chance of reaching 1.5℃ before the clock’s date, and similarly that there is a 50 per cent chance that the 1.5℃ date will occur later than shown.
To increase the confidence that we have not overestimated the remaining time, we could instead use a smaller estimate of the remaining carbon budget. Setting allowable future emissions to 570 billion tonnes rather than 770 billion tonnes, for example, would move the 1.5℃ date four years earlier to about the year 2030. This in turn would increase our confidence of not overestimating the time remaining before we reach 1.5℃ from 50 to 67 per cent.
Another source of uncertainty is how we choose to define global temperature itself. Here we have used the World Meteorological Organization’s (WMO) standard definition of global temperature. It is based on available measurements, which are spatially incomplete and also combine air and surface ocean temperature measurements to estimate the global mean surface temperature. If we based the clock on only air temperature estimates with full global coverage — which require either climate models or uncertain spatial interpolation of available temperature data — the remaining carbon budget would be decreased from 770 billion to 580 billion tonnes, and the 1.5℃ date would again move four years closer in time.
How do we add time to the clock?
Perhaps the most important uncertain factor is the question of how hard the world will try to decrease future CO2 and other greenhouse gas emissions. Clearly, if fossil fuel CO2 emissions continue to increase, we will continue to lose time between now and when we reach 1.5℃. Similarly, if the rate of deforestation or emissions of methane accelerate, this will also move 1.5℃ closer in time.
Current national emissions targets are not sufficient to avoid 1.5℃: if all countries meet their 2030 targets, this would delay 1.5℃ by only half a year. Similarly, holding CO2 emissions constant at today’s level would buy only 14 months of additional time.
If we are able to decrease CO2 emissions to zero by the year 2080, we might avoid 2℃ of global temperature increase, but would pass 1.5℃ before the year 2040. To actually avoid 1.5℃ altogether, CO2 emissions from both fossil fuels and deforestation would need to be eliminated by the year 2050.
Avoiding the impacts of more than 1.5℃ of warming will require individuals, businesses and governments to cooperate and prioritize climate action at all levels of decision-making. It is only through bold and ambitious action that we will be able to add enough time to the clock to avoid the most dangerous consequences of continued climate warming.
This is a daunting challenge, and we may not succeed. But we will clearly fail if we do not try much harder than we have done so far.
David Usher, musician and director of the Human Impact Lab, is the co-creator of the Climate Clock.
![]()
H. Damon Matthews, Professor and Concordia University Research Chair in Climate Science and Sustainability, Concordia University; Glen Peters, Research Director, Center for International Climate and Environment Research - Oslo; Myles Allen, Professor of Geosystem Science, Leader of ECI Climate Research Programme, University of Oxford, and Piers Forster, Professor of Physical Climate Change; Director of the Priestley International Centre for Climate, University of Leeds
This article is republished from The Conversation under a Creative Commons license. Read the original article.
"Voices of the RSC” is a series of written interventions from Members of the Royal Society of Canada. The articles provide timely looks at matters of importance to Canadians, expressed by the emerging generation of Canada’s academic leadership. Opinions presented are those of the author(s), and do not necessarily reflect the views of the Royal Society of Canada.